

Abuse Scenarios
A threat on its own is a line item. An abuse scenario is the order those line items happen in — the chain that turns three findings into one breach.
What an abuse scenario is
An abuse scenario is an ordered chain of threats you already have, assembled into a single attack narrative: how this system actually gets compromised, step by step. It never invents a threat. Every link is a canonical finding one of the frameworks already produced on one of your assets or dataflows.
It is an analysis layer, and it is read-only with respect to your numbers. A scenario's impact, probability, and priority never move the project's exposure score. They tell you which combination of existing threats deserves attention first — not how exposed the project is.
Before you generate
Scenarios are assembled out of threats, so you need threats first — run at least one framework assessment on the project before generating anything here.
Generating them
One button starts a run, and the run happens in the background — the page keeps refreshing on its own while it works, so there's nothing to poll and no reason to reload. A single run is capped at 80 scenarios. The button is hidden entirely from viewers; read-only means read-only, including here.
Reading the matrix
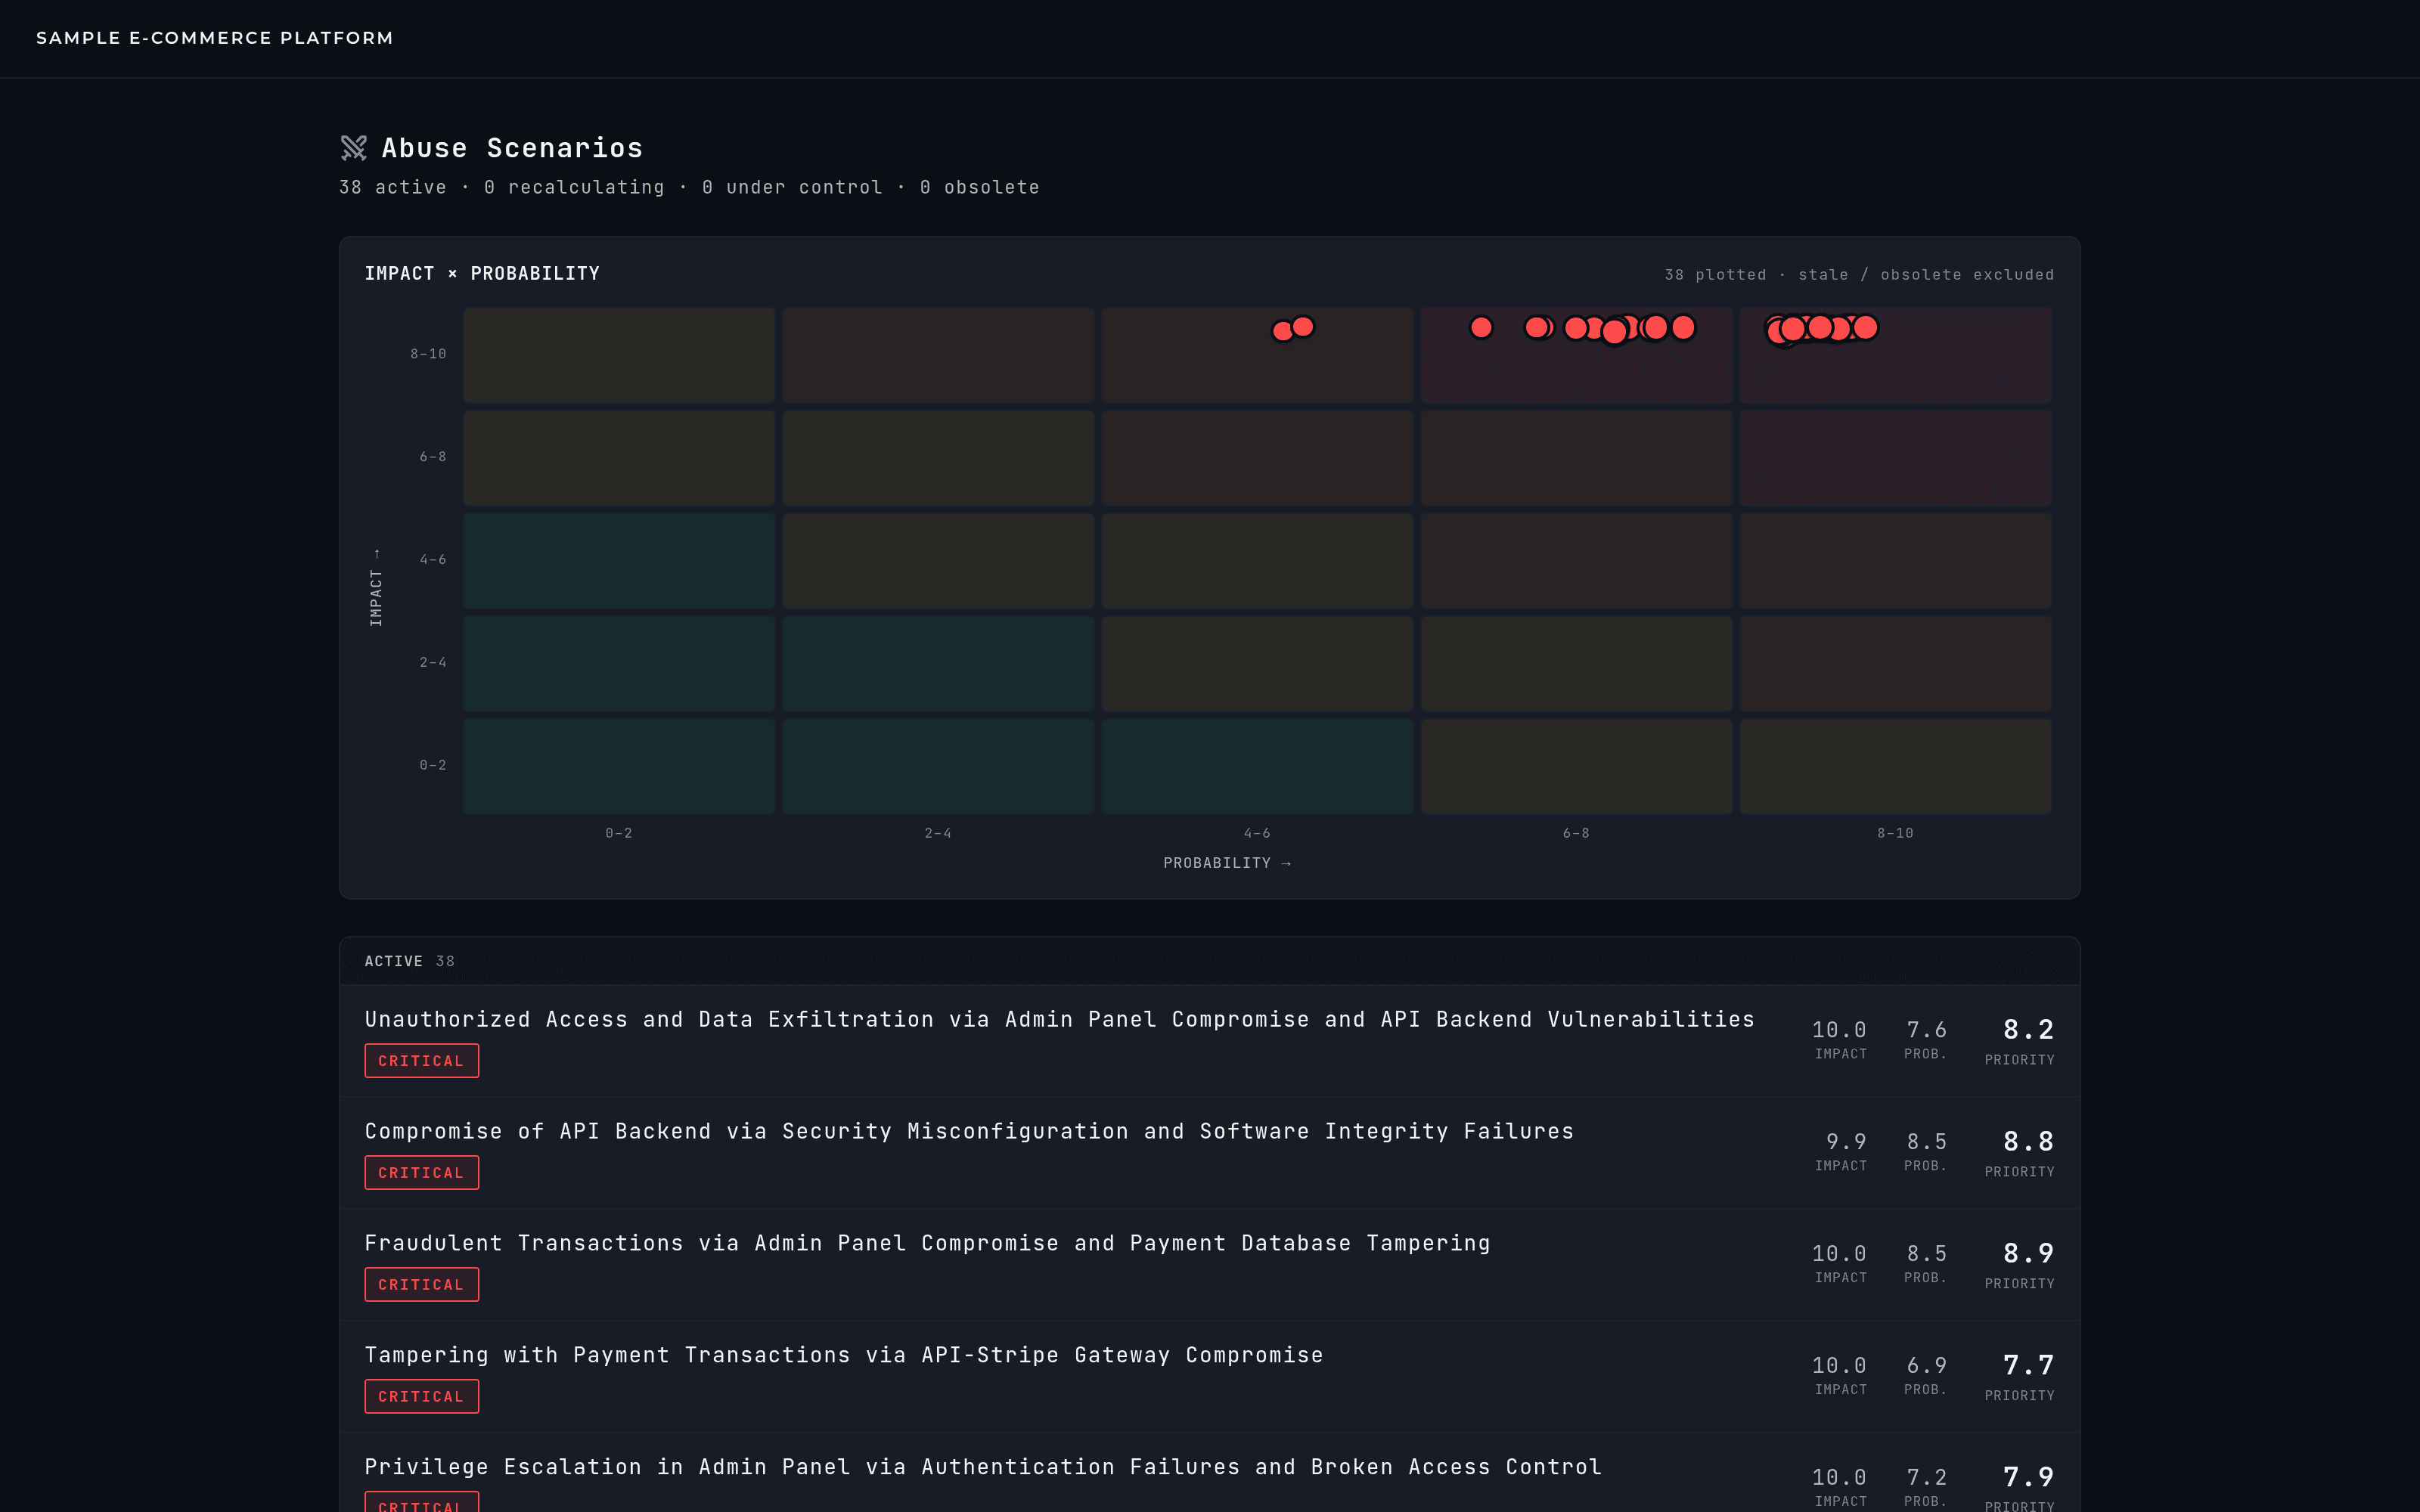
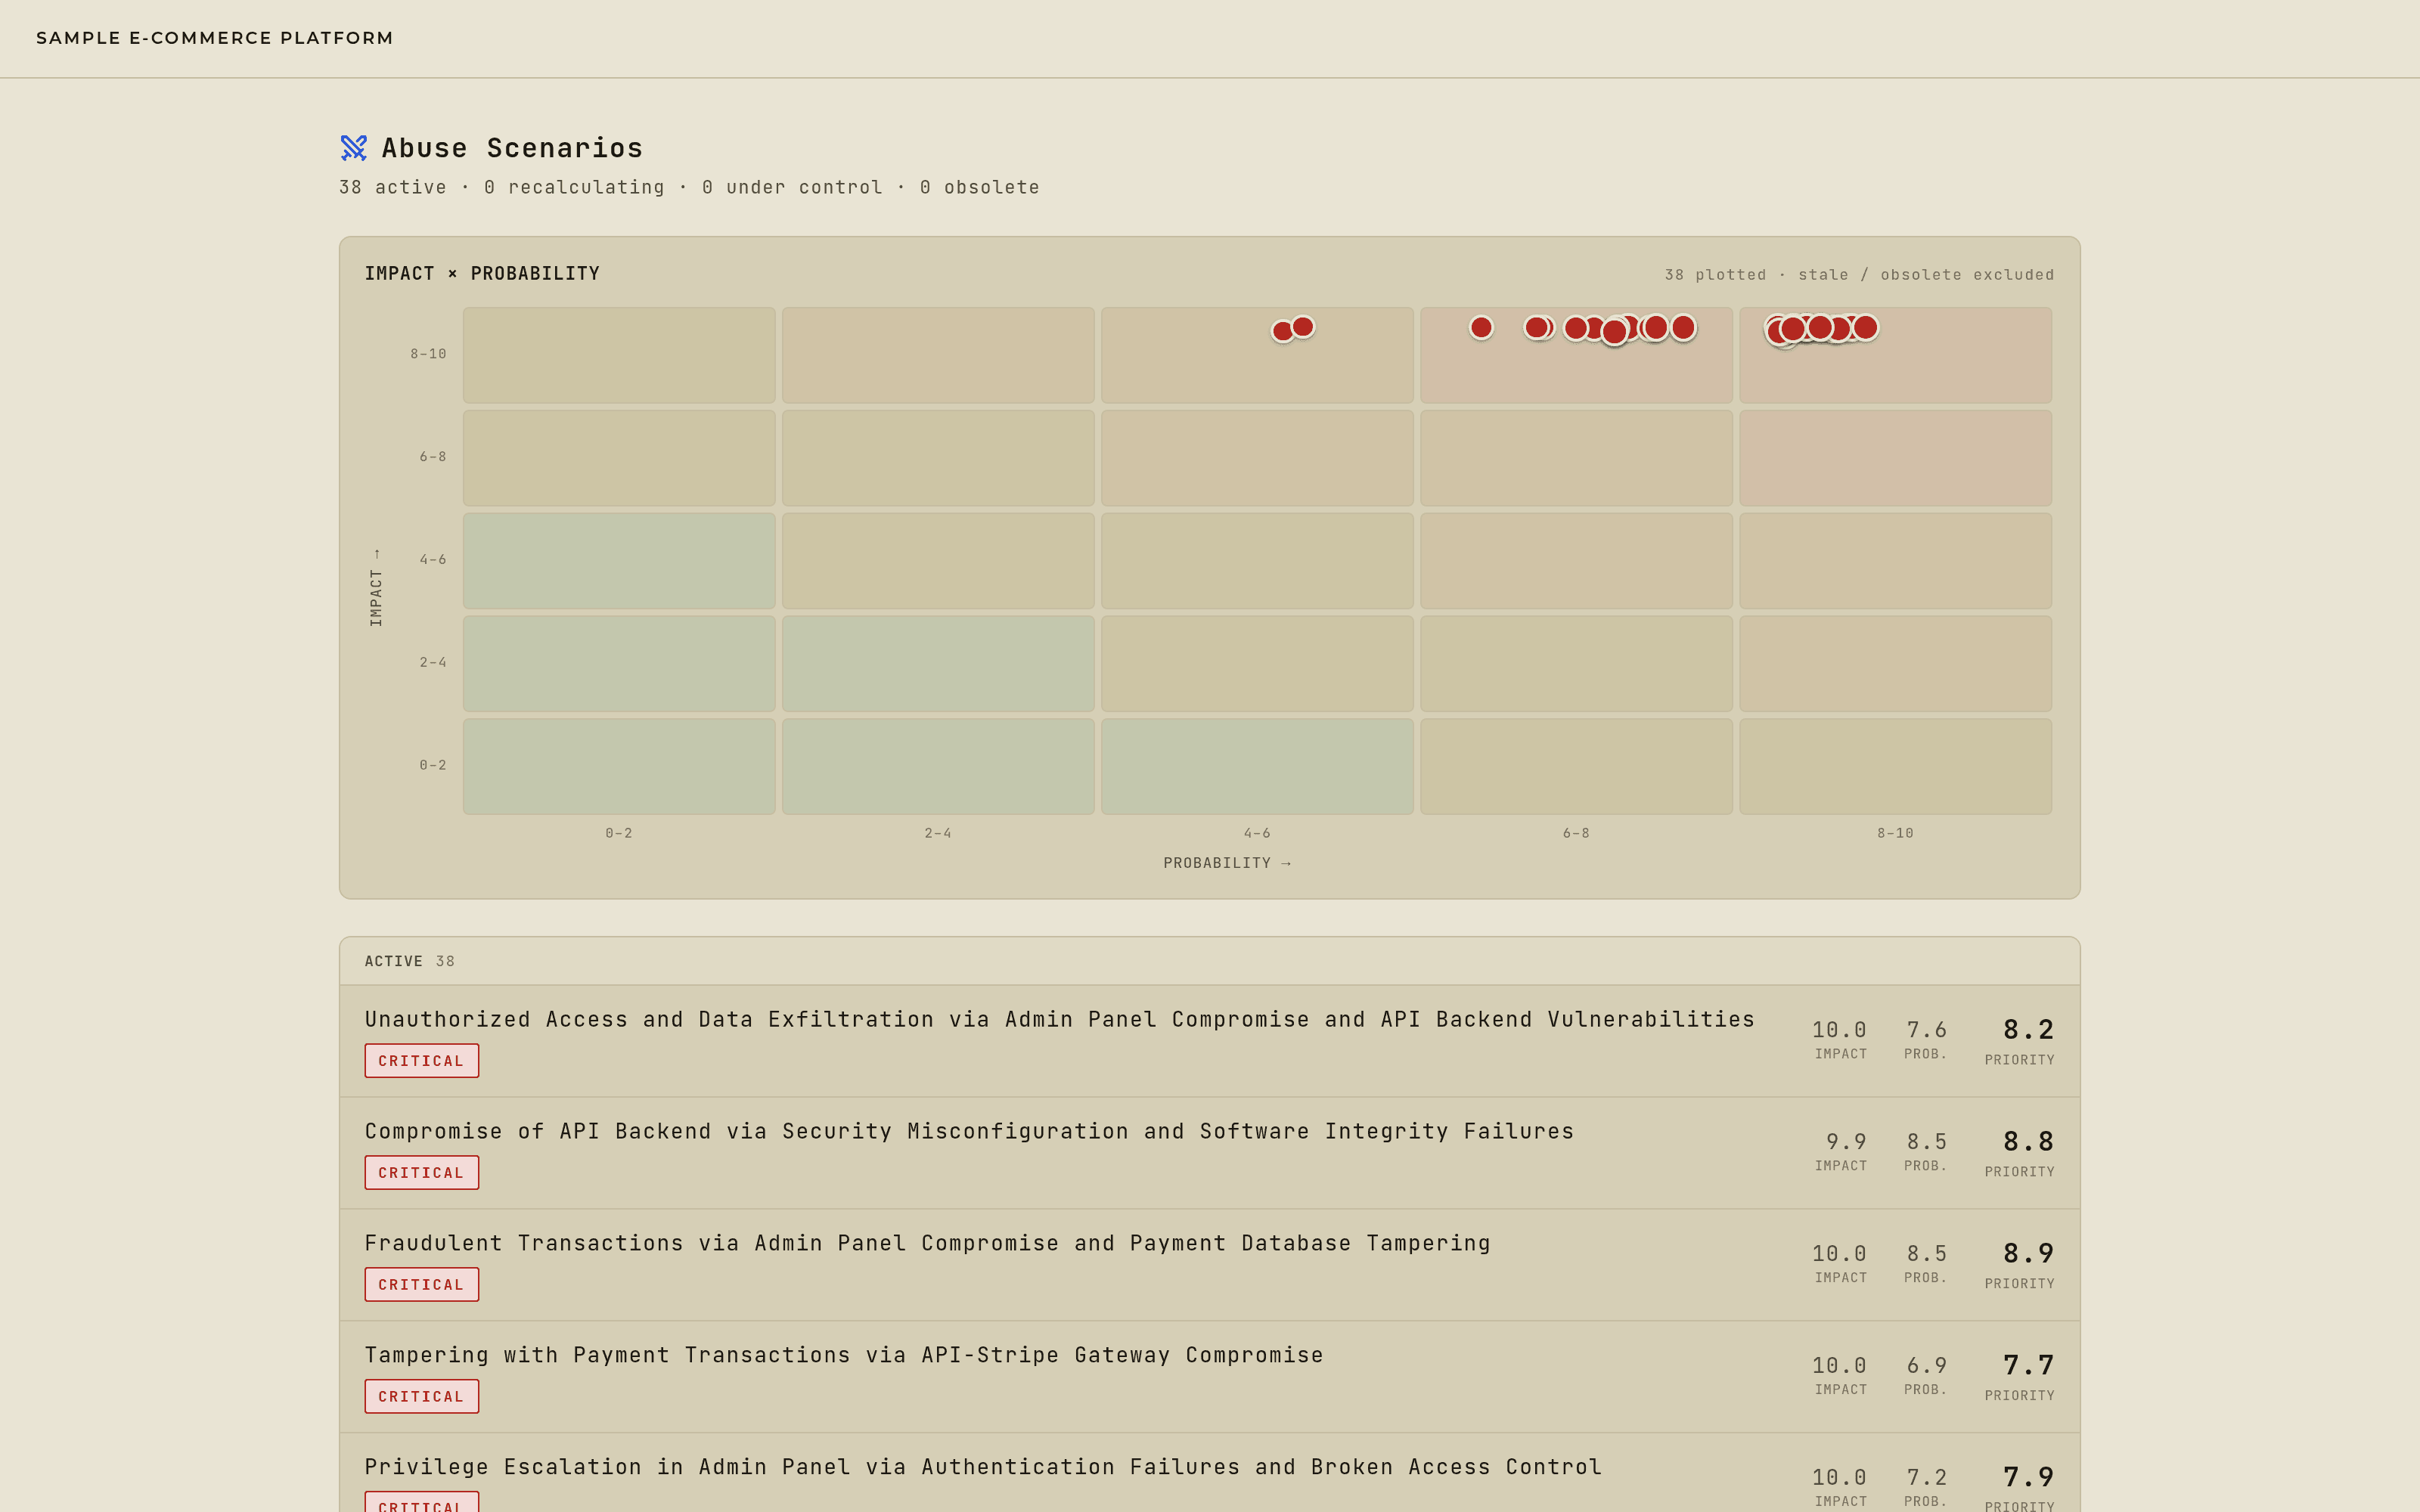
The matrix is five buckets of impact by five buckets of probability, 0–2 through 8–10. Each active scenario is one dot, placed at its exact value inside its cell rather than in the middle of it — so two scenarios sharing a cell still read as different.
- DOT COLOR
- the priority band — critical, high, medium, or low.
- DOT SIZE
- the priority score itself, so the most urgent scenario is also the largest mark on the grid.
- WHAT'S LEFT OFF
- scenarios marked obsolete, and scenarios currently being re-scored, are excluded from the plot rather than drawn at a number that's no longer true.
Inside a scenario
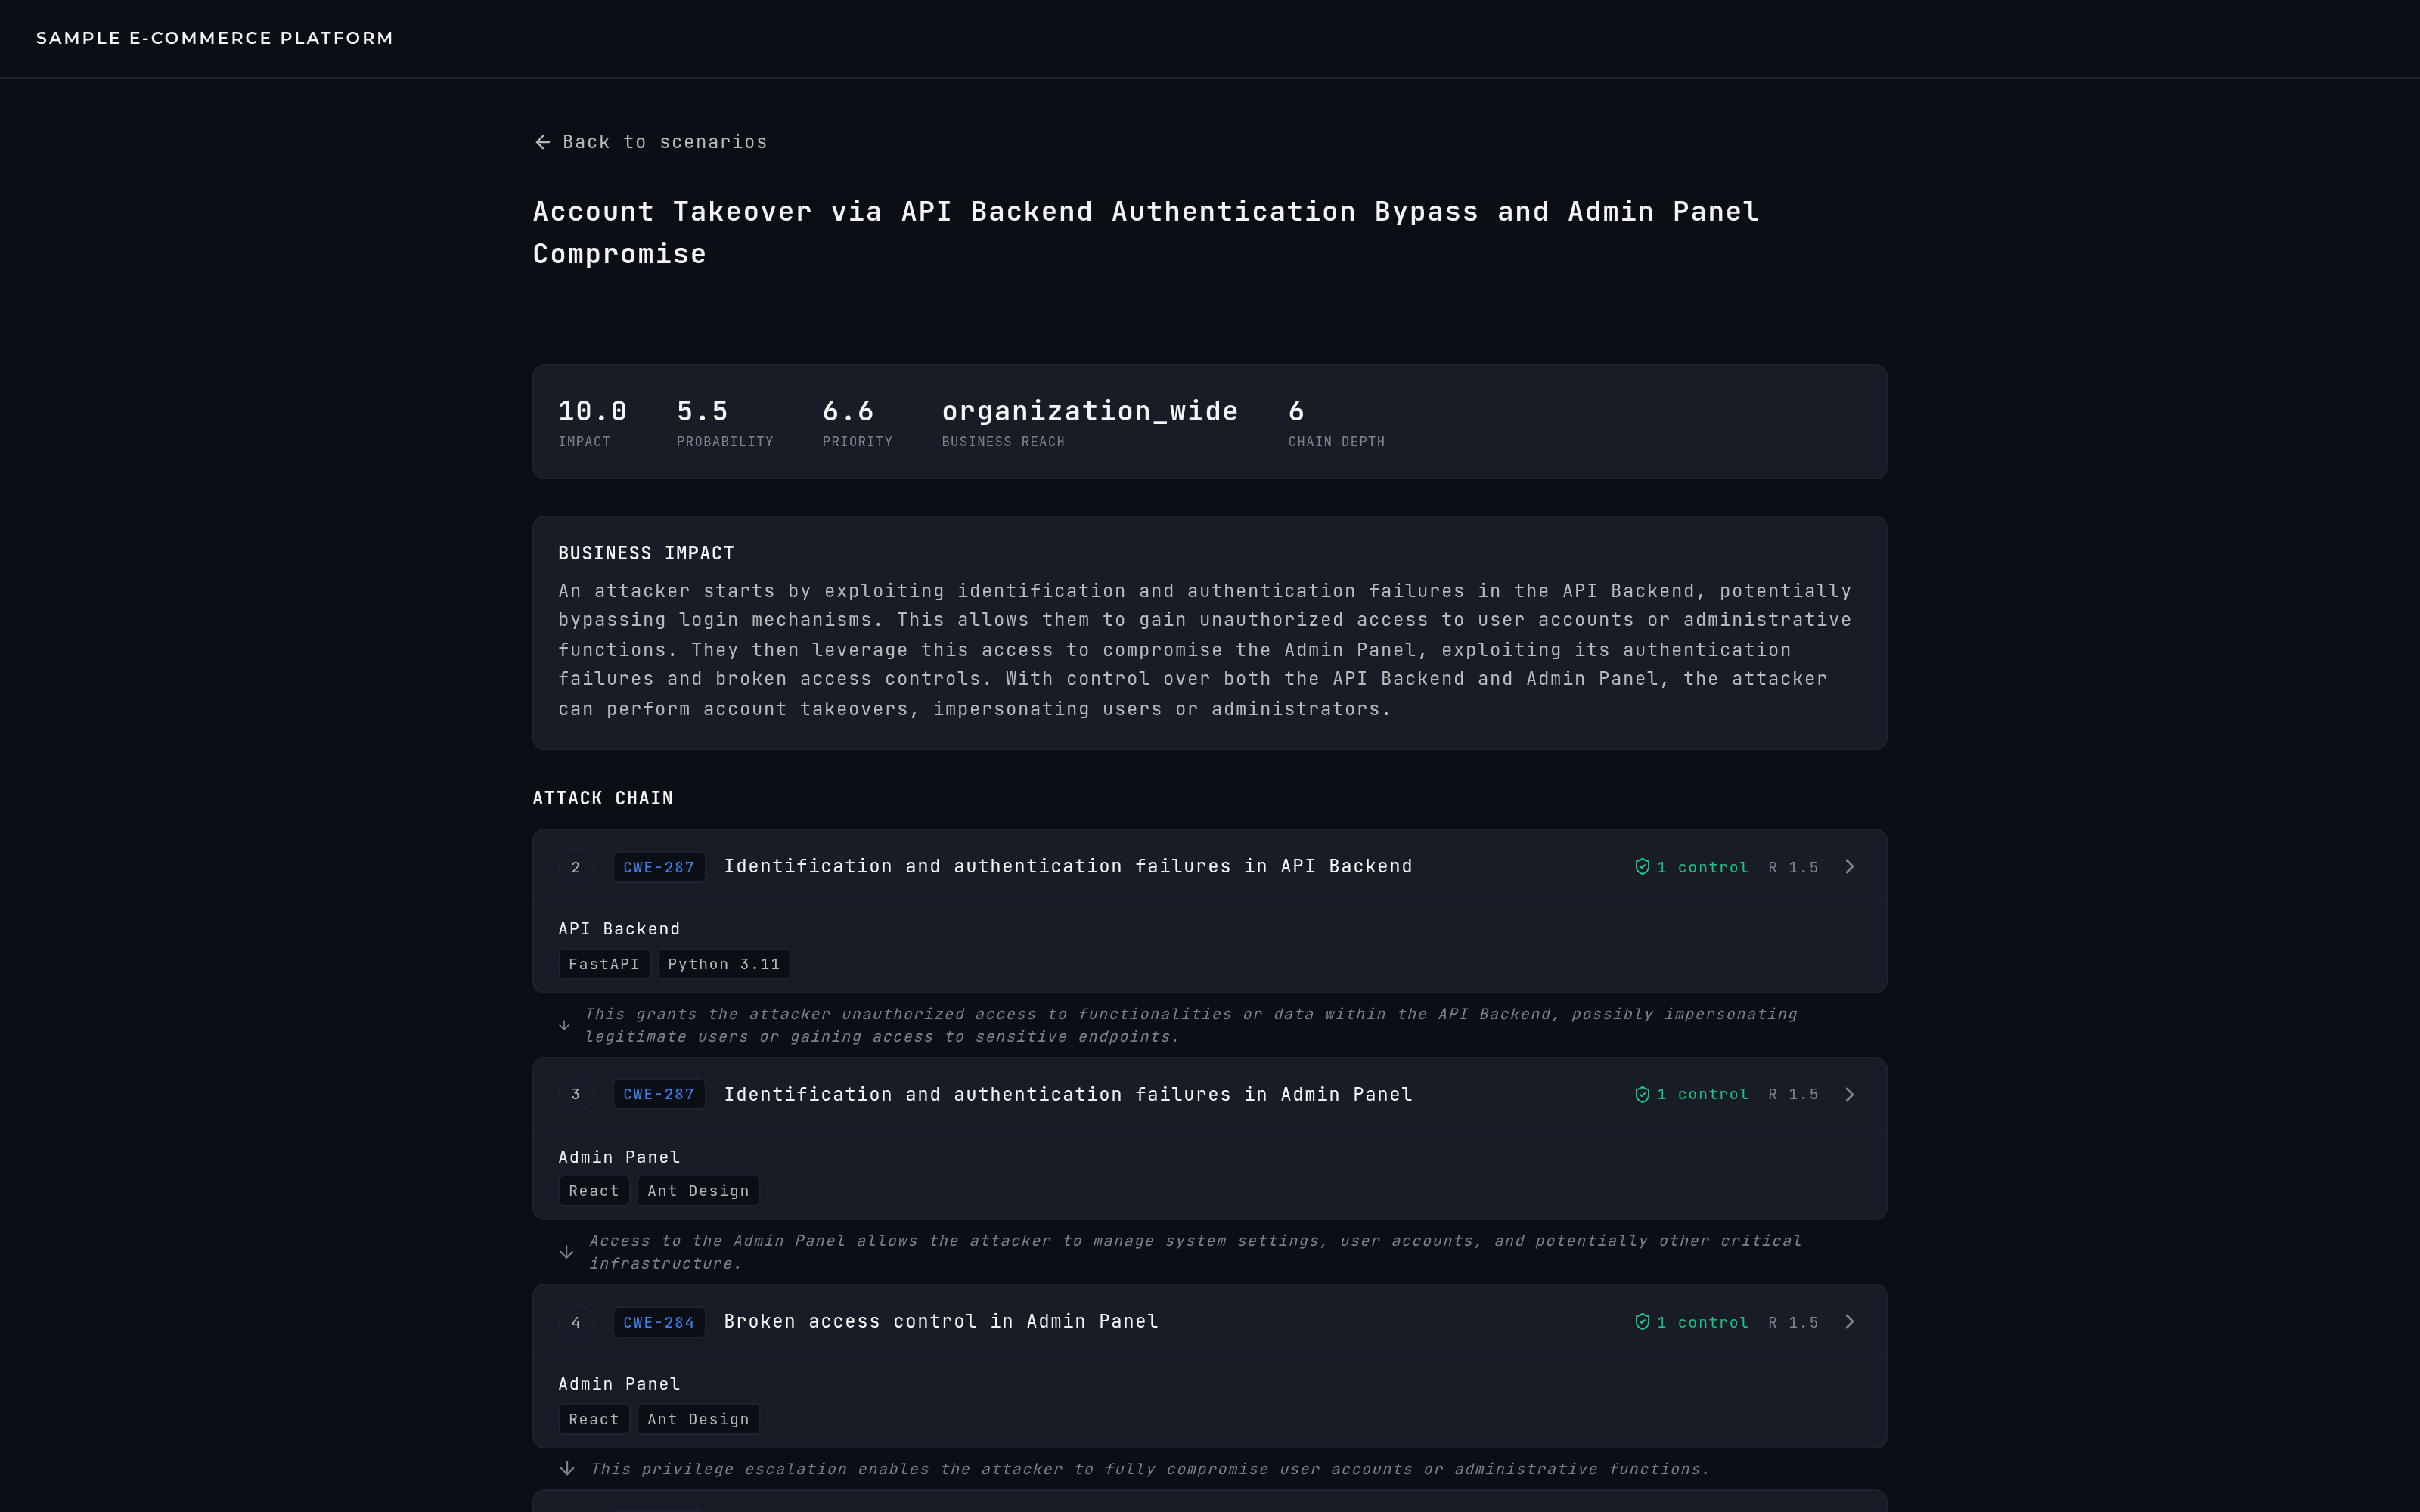
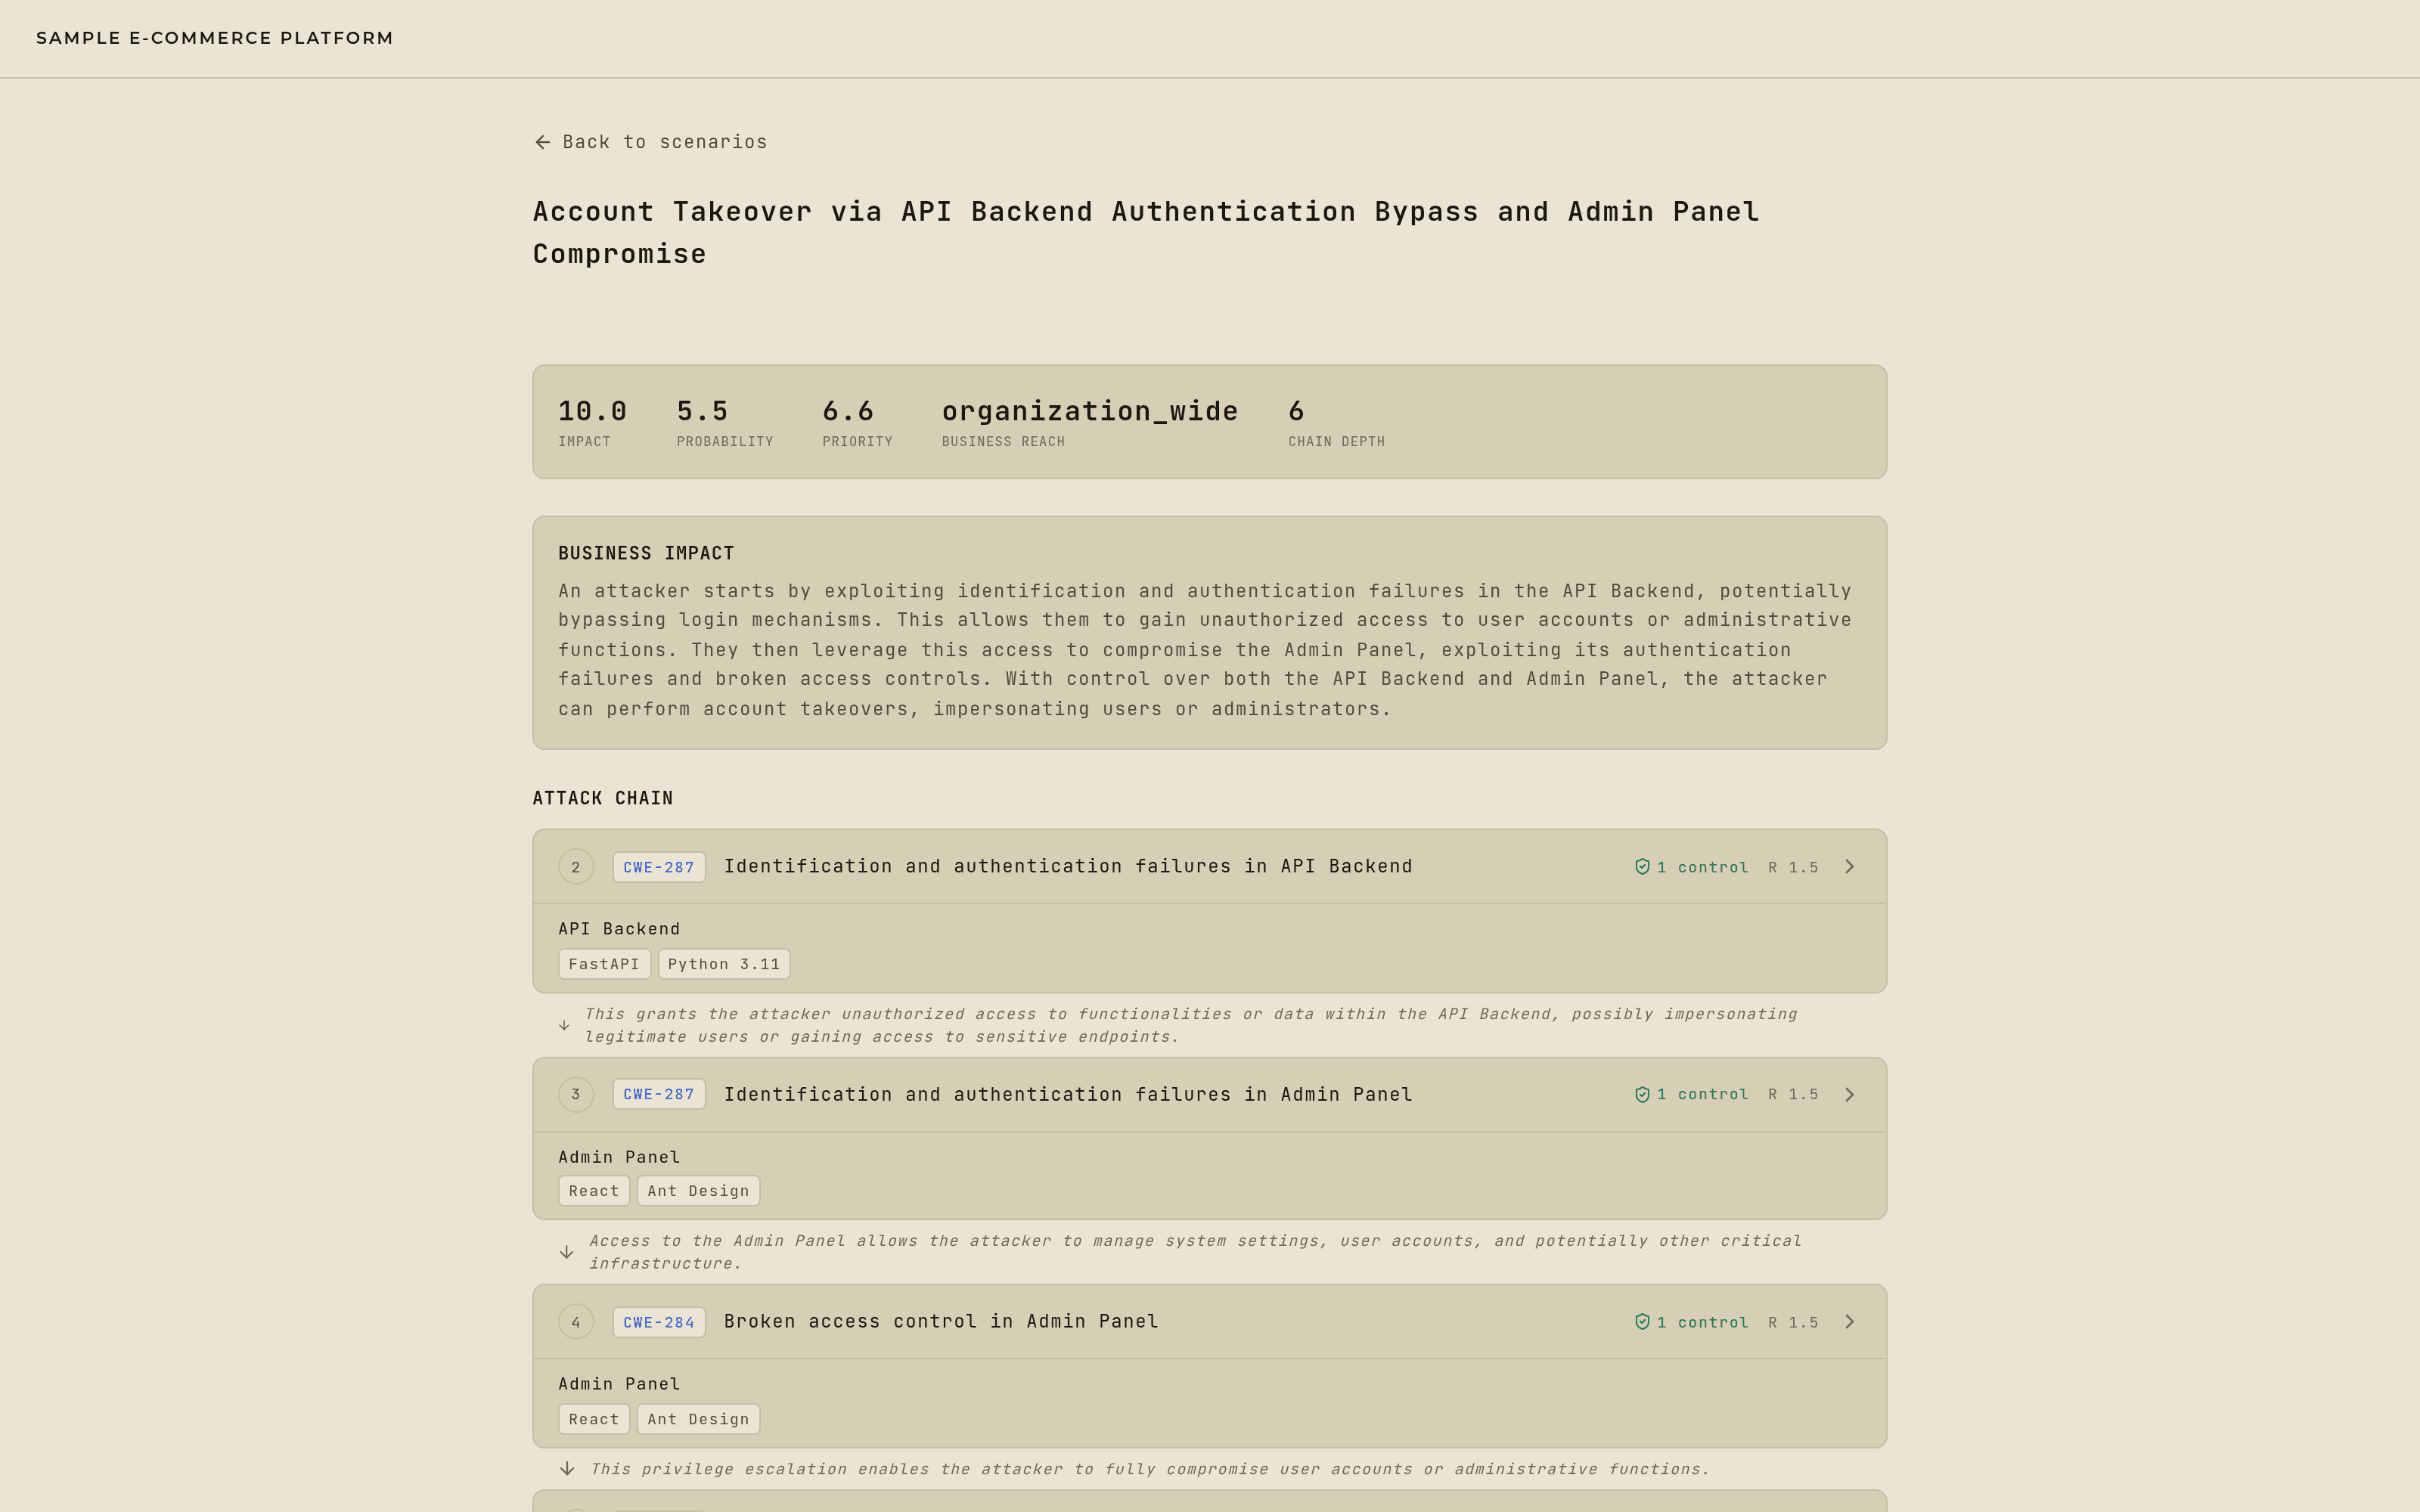
Opening one gives you a stat strip — impact, probability, priority, business reach, chain depth — then a narrative of what this would actually cost the business, then the entry assumptions the chain depends on, each marked common, plausible, or rare.
Below that is the chain itself, numbered in order. Each link names the CWE it maps to, the threat, and what it lands on: for an asset, the technologies running on it; for a dataflow, its source and target and whether it crosses a trust boundary. Each link also shows how many controls defend it and how much resistance those controls actually produce — and closes with a note on how this link enables the next one, which is the part a flat list of threats can never tell you.
Statuses
- OPEN
- active and plotted on the matrix. The default state.
- UNDER CONTROL
- a consultant has settled it. The scenario is kept and stays readable, drops off the matrix, survives regeneration, and can carry a free-text note recording what was done about it.
- OBSOLETE
- the threats underneath it no longer exist, or it was retired by hand. Kept for the record, excluded from everything else.
Chain depth and business reach
- CHAIN DEPTH
- how many links the chain has.
- BUSINESS REACH
- how far the damage spreads — localized to one function, across a department, or organization-wide.
Where the numbers come from
Worth stating plainly, because it's the part most tools get away with hiding: these scores are deterministic arithmetic, not model output. Resistance on a link comes from the threat's CVSS exploitability and the measured effectiveness of the controls defending it. Probability comes from the weakest link in the chain, adjusted for how plausible the entry assumption is. Impact grows with chain depth and business reach. Priority combines impact and probability.
The AI writes the prose and only the prose: which threats plausibly chain together, the business narrative, and the reach and plausibility labels. Every number is reproducible from the same inputs. As everywhere else in the engine, the constants and weights behind that arithmetic stay internal — the structure is public, the calibration isn't.
When the data isn't there
Two cases the platform reports honestly rather than papering over:
- A THREAT WITH NO CVSS DATA
- its impact renders as a lower bound — "≥ 8.2" — behind a Not scored pill, instead of a confident number the underlying data doesn't support.
- A LINK WITH NO CONTROL
- flagged No control. That's a finding about your coverage, not an error in the scenario.