

Reading the Overview
The overview is where a project lands once the analysis has run. It answers one question — how exposed is this system — and every other panel on the screen exists to show you how that answer was reached.
The exposure score
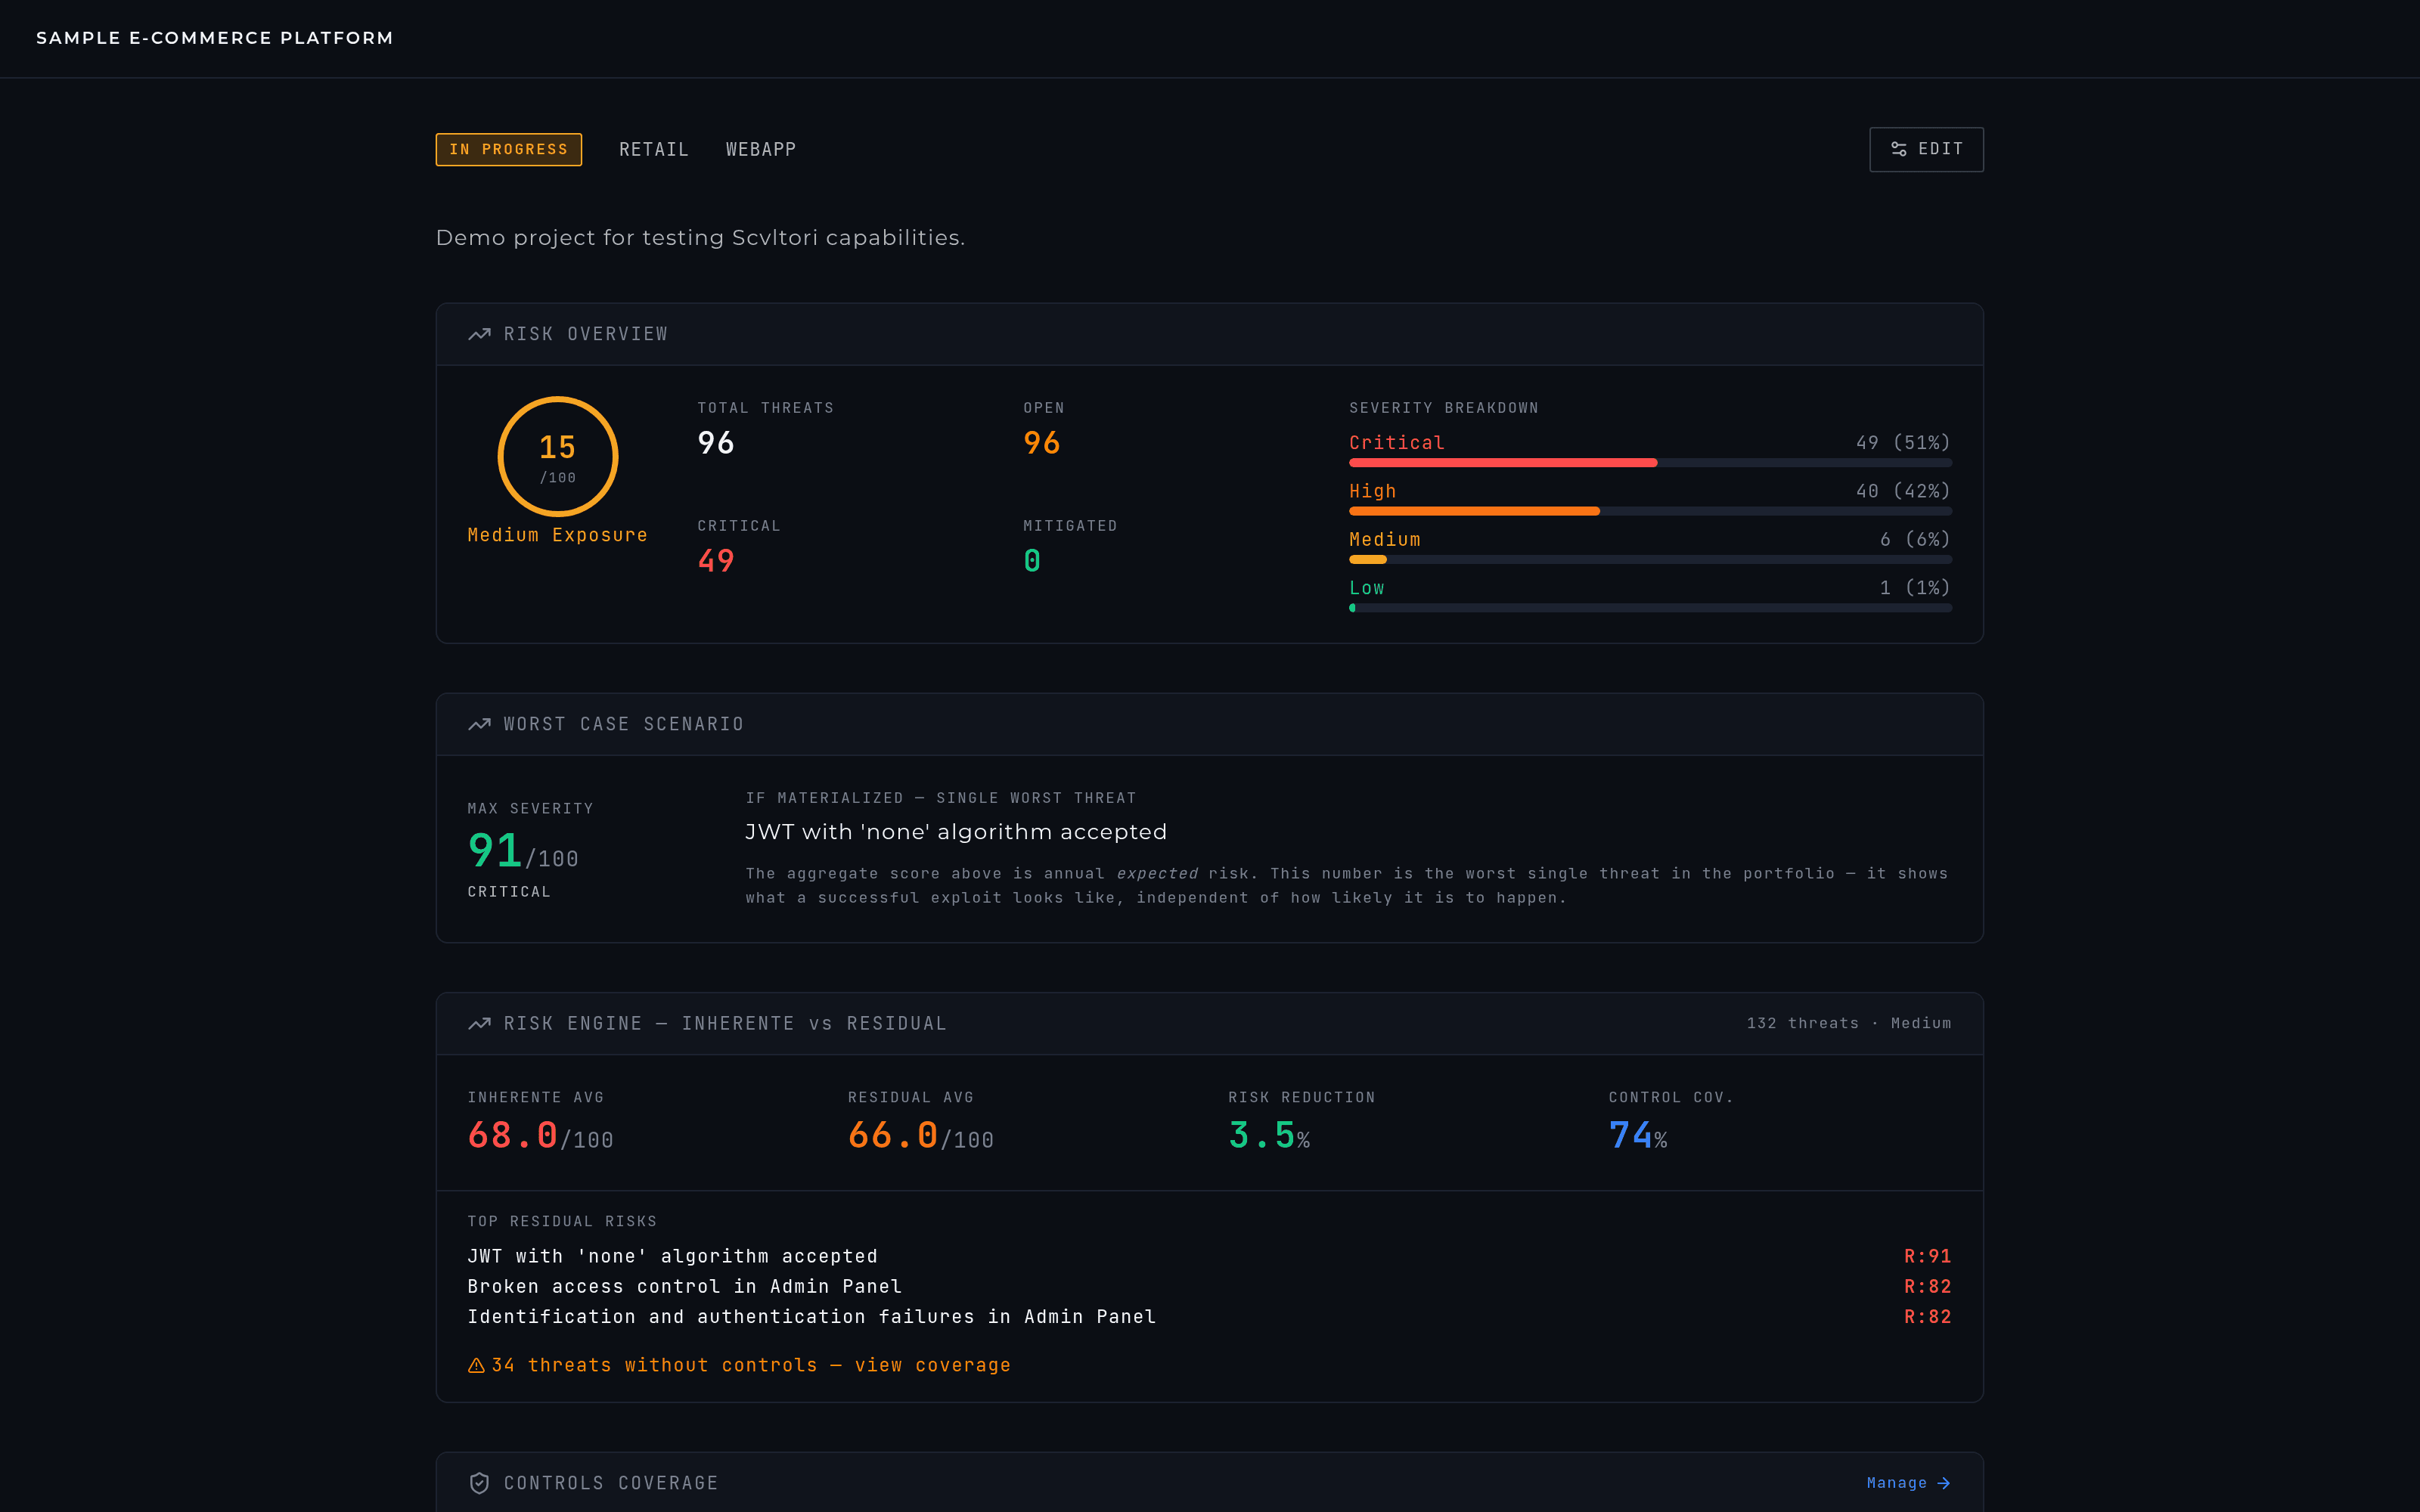
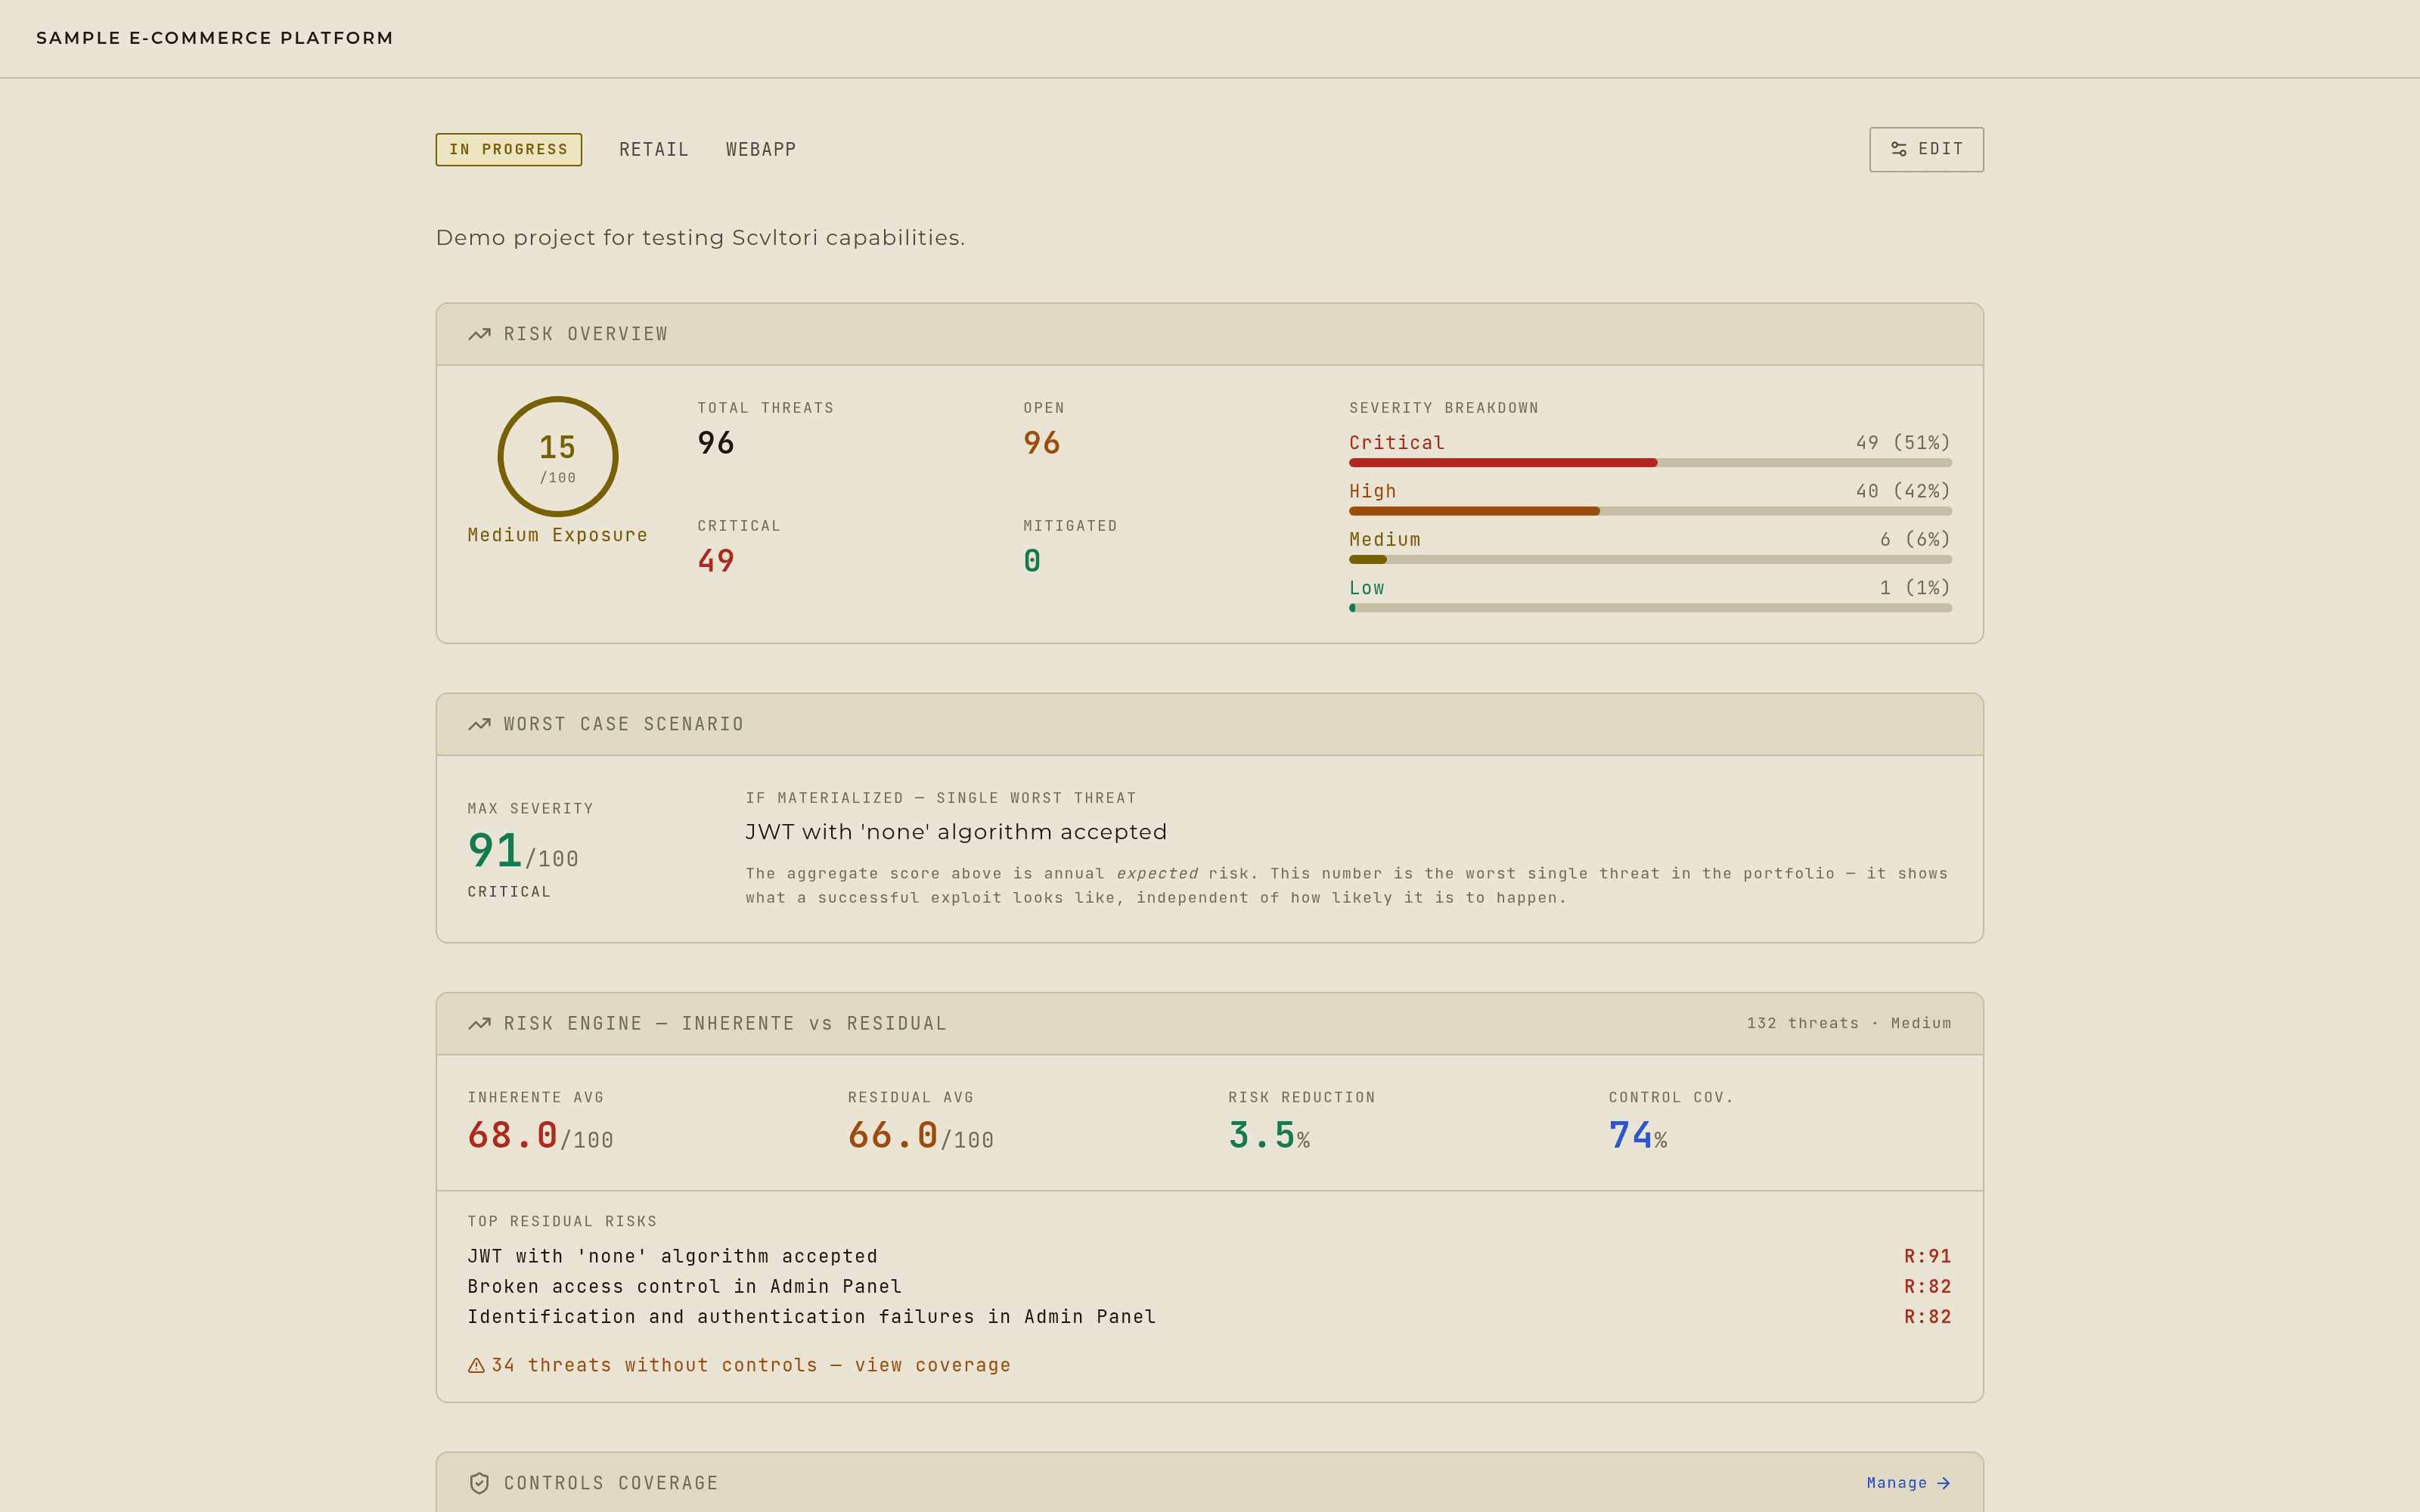
The ring is a single number from 0 to 100, with a word beside it: Low, Medium, High, Critical or Severe. Read the word first. The number is probability-adjusted annual expected risk, not raw severity, so its range is compressed compared to the CVSS scores you may be used to — a well-controlled organization sits near the bottom of the scale, a typical one lands somewhere in the teens, and a system with no controls and internet exposure runs away toward the top.
That compression is the point. A score that only measured how bad things could be would read Critical for everyone, forever, and would help you decide nothing. This one moves when your controls move.
- LOW · 0 to 8
- a well-controlled system. Getting here takes real controls: implemented, verified, and linked to the threats they cover.
- MEDIUM · 9 to 25
- where a competent organization usually sits, which is why a 15 here is not a bad grade. It is the normal reading for a system with controls in place and real threats still open. If you expected a good result to be a number near zero, that is the misunderstanding: zero would mean nothing is left to address, and no system in production is there.
- HIGH · 26 to 50
- the controls are no longer keeping up with the exposure. Usually broad but weak coverage, or critical threats with nothing linked.
- CRITICAL · 51 to 75
- poorly controlled, or exposed through paths nothing is defending.
- SEVERE · 76 to 100
- no controls that count, on a system reachable from the internet. This is an escalation, not a backlog item.
Why the worst case is a much bigger number
Directly under the score you'll see a max severity that looks alarmingly higher — 91 next to an exposure of 15 is normal, not a bug. They measure different things.
The exposure score is expected risk: what this system is likely to cost you over a year, weighing how probable each threat is. Max severity ignores probability entirely and shows the single worst threat in the portfolio — what a successful exploit looks like if it happens at all. One is the forecast, the other is the ceiling. You need both: a low expected risk with a very high ceiling is a different conversation than a low ceiling.
Inherent against residual
This panel is where the controls earn their place. Inherent is the average risk before any control is credited. Residual is the same set of threats after the effectiveness of the controls you have linked to them. The gap between the two is what your safeguards are actually buying you.
Risk reduction reads that gap as a percentage — and it accounts for treatment status too, not only control effectiveness, so a threat you marked accepted or mitigated changes it. Control coverage is a different measure: the share of threats that have at least one control attached, whether or not that control is doing much. High coverage with low reduction means you have controls in place that are not moving the number.
- TOP RESIDUAL RISKS
- the handful of threats still carrying the most risk after controls — the shortest useful to-do list on the screen.
- THREATS WITHOUT CONTROLS
- a count, linked to the coverage view. These are threats contributing their full weight because nothing is defending them yet.
When the numbers move
Scores are recalculated in the background whenever something that feeds them changes: a new threat, a control linked or unlinked, a treatment status updated. The screen does not block while that runs, so a number can be a few seconds behind the change you just made. Reload if a figure looks stale.